Note
Click here to download the full example code
2.3.4. Lugiato-Lefever equation – Soliton molecules
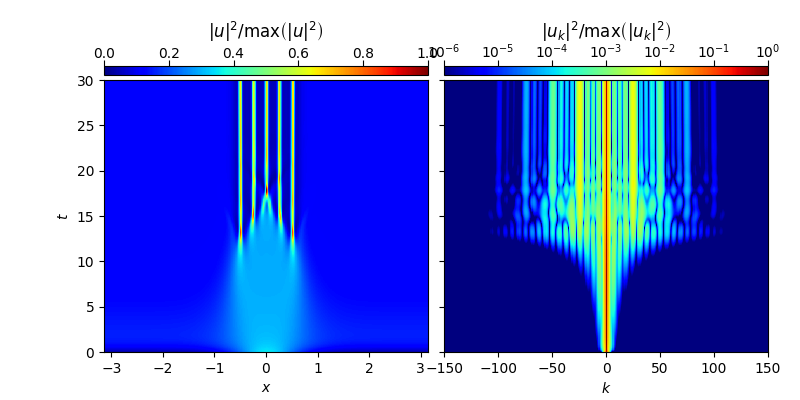
This example shows how to perform simulations for the Lugiato-Lefever equation (LLE) [1], using functionality implemented by py-fmas.
In particular, this example implements the first-order propagation equation
where \(u\equiv u(x,t)\) is a complex field. The temporal evolution is governed by the frequency detuning \(\theta=2\), the constant driving amplitude \(P=1.37225\), and second order dispersion parameter \(d_2=-0.002\). Equations of this type allow to describe the propagation of optical pulses in ring cavities.
The example provided below shows how an initial condition of the form
evolves into a soliton molecule consisting of 5 cavity solitons. This propagation scenario reporduces the soliton molecule shown in Fig. 9(e) of Ref. [2].
- References:
[1] L.A. Lugiato, R. Lefever, Spatial Dissipative Structures in Passive Optical Systems, Phys. Rev. Lett. 58 (1987) 2209, https://doi.org/10.1103/PhysRevLett.58.2209.
[2] C. Godey, I.V. Balakireva, A. Coillet, Y. K. Chembo, Stability analysis of the spatiotemporal Lugiato-Lefever model for Kerr optical frequency combs in the anomalous and normal dispersion regimes, Phys. Rev. A 89 (2014) 063814, http://dx.doi.org/10.1103/PhysRevA.89.063814.

import fmas
import numpy as np
import matplotlib as mpl
import matplotlib.pyplot as plt
import matplotlib.colors as col
from fmas.config import FTSHIFT, FTFREQ, FT, IFT
from fmas.solver import SiSSM


def plot_evolution_LLE(z, t, u, t_lim, w_lim):

    def _setColorbar(im, refPos):
        """colorbar helper"""
        x0, y0, w, h = refPos.x0, refPos.y0, refPos.width, refPos.height
        cax = f.add_axes([x0, y0+1.02*h, w, 0.03*h])
        cbar = f.colorbar(im, cax=cax, orientation='horizontal')
        cbar.ax.tick_params(color='k',
                            labelcolor='k',
                            bottom=False,
                            direction='out',
                            labelbottom=False,
                            labeltop=True,
                            top=True,
                            size=4,
                            pad=0
                            )

        cbar.ax.tick_params(which="minor", bottom=False, top=False )
        return cbar

    w = FTSHIFT(FTFREQ(t.size,d=t[1]-t[0])*2*np.pi)

    f, (ax1, ax2) = plt.subplots(1, 2, sharey=True, figsize=(8,4))
    plt.subplots_adjust(left=0.13, right=0.96, bottom=0.12, top=0.8, wspace=0.05)
    cmap=mpl.cm.get_cmap('jet')

    # -- LEFT SUB-FIGURE: TIME-DOMAIN PROPAGATION CHARACTERISTICS
    It = np.abs(u)**2
    It/=np.max(It)

    my_norm=col.Normalize(vmin=0,vmax=1)
    im1 = ax1.pcolorfast(t, z, It[:-1,:-1], norm=my_norm, cmap=cmap)
    cbar1 = _setColorbar(im1,ax1.get_position())
    cbar1.ax.set_title(r"$|u|^2/{\rm{max}}\left(|u|^2\right)$",color='k',y=3.5)
    ax1.set_xlim(t_lim)
    ax1.set_ylim([0.,z.max()])
    ax1.set_xlabel(r"$x$")
    ax1.set_ylabel(r"$t$")
    ax1.ticklabel_format(useOffset=False, style='plain')

    # -- RIGHT SUB-FIGURE: ANGULAR FREQUENCY-DOMAIN PROPAGATION CHARACTERISTICS
    Iw = np.abs(FTSHIFT(FT(u, axis=-1),axes=-1))**2
    Iw /= np.max(Iw)
    im2 = ax2.pcolorfast(w,z,Iw[:-1,:-1],
                         norm=col.LogNorm(vmin=1e-6*Iw.max(),vmax=Iw.max()),
                         cmap=cmap
                         )
    cbar2 =_setColorbar(im2,ax2.get_position())
    cbar2.ax.set_title(r"$|u_k|^2/{\rm{max}}\left(|u_k|^2\right)$",color='k',y=3.5)
    ax2.set_xlim(w_lim)
    ax2.set_ylim([0.,z.max()])
    ax2.set_xlabel(r"$k$")
    ax2.tick_params(labelleft=False)
    ax2.ticklabel_format(useOffset=False, style='plain')

    plt.show()


def main():
    # -- DEFINE SIMULATION PARAMETERS
    x_max, Nx = np.pi, 512
    t_max, Nt = 30.0, 60000
    n_skip = 60
    P, theta, d2 = 1.37225, 2., -0.002

    # -- INITIALIZATION STAGE
    # ... COMPUTATIONAL DOMAIN
    x = np.linspace(-x_max, x_max, Nx, endpoint=False)
    k = FTFREQ(x.size,d=x[1]-x[0])*2*np.pi
    # ... LUGIATO-LEFEVER MODEL
    Lk = lambda k: -(1+1j*theta)  + 1j*d2*k*k
    Nk = lambda uk: ( lambda ut: (FT(1j*np.abs(ut)**2*ut + P )))( IFT(uk))
    # ... SOLVER BASED ON SIMPLE SPLIT-STEP FOURIER METHOD
    solver = SiSSM(Lk(k), Nk)
    # ... INITIAL CONDITION
    u_0k = FT(0.5 + np.exp(-(x/0.85)**2) + 0j)
    solver.set_initial_condition(k, u_0k)

    # -- RUN SIMULATION
    solver.propagate(z_range = t_max, n_steps = Nt, n_skip = n_skip)
    t_, uxt = solver.z, solver.utz

    x_lim = (-np.pi,np.pi)
    k_lim = (-150,150)
    plot_evolution_LLE(t_, x, uxt, x_lim, k_lim)


if __name__=='__main__':
    main()
Total running time of the script: ( 0 minutes 4.720 seconds)