Note
Click here to download the full example code
2.3.3. Korteweg-deVries equation – Interaction of solitons
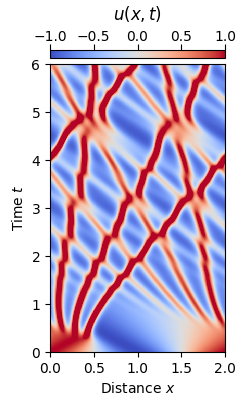
This example solves the Korteweg-deVries (KdV) equation, given by
\[\partial_t u = - \delta^2 \partial_x^3 u -u \partial_x u,\]
wherein the evolution of the real-valued field \(u = u(t, x)\) is determined by the parameter \(\delta=0.022\).
The propagation scenario below considers the initial condition
\[u_0(x) = \cos(\pi x), \quad 0\leq x \leq 2,\]
and uses a pseudospectral integrating factor method, i.e. the “Runge-Kutta in the interaction picture” method implemented in the py-fmas libragy, to reproduce the data shown in Fig. 2 of Ref. [1].
- References:
[1] N. J. Zabusky, M. D. Kruskal, Interaction of “Solitons” in a Collisionless Plasma and the Recurrence of Initial States, Phys. Rev. Lett. 15 (1965) 240, https://doi.org/10.1103/PhysRevLett.15.240.

import fmas
import numpy as np
import matplotlib as mpl
import matplotlib.pyplot as plt
import matplotlib.colors as col
from fmas.config import FTFREQ, FT, IFT, C0
from fmas.solver import IFM_RK4IP


def plot_evolution_KdV(t, x, u):

    def _setColorbar(im, refPos):
        """colorbar helper"""
        x0, y0, w, h = refPos.x0, refPos.y0, refPos.width, refPos.height
        cax = f.add_axes([x0, y0+1.02*h, w, 0.03*h])
        cbar = f.colorbar(im, cax=cax, orientation='horizontal')
        cbar.ax.tick_params(color='k',
                            labelcolor='k',
                            bottom=False,
                            direction='out',
                            labelbottom=False,
                            labeltop=True,
                            top=True,
                            size=4,
                            pad=0
                            )

        cbar.set_ticks((-1,-0.5,0,0.5,1))
        cbar.ax.tick_params(which="minor", bottom=False, top=False )
        return cbar

    f, ax1 = plt.subplots(1, 1, sharey=True, figsize=(2.5,4))
    plt.subplots_adjust(left=0.2, right=0.9, bottom=0.12, top=0.84)
    cmap=mpl.cm.get_cmap('coolwarm')

    im1 = ax1.pcolorfast(x, t, u[:-1,:-1],
                         norm=col.Normalize(vmin=-1,vmax=1),
                         cmap=cmap
                         )
    cbar1 = _setColorbar(im1,ax1.get_position())
    cbar1.ax.set_title(r"$u(x,t)$",color='k',y=3.5)
    ax1.xaxis.set_ticks_position('bottom')
    ax1.yaxis.set_ticks_position('left')
    ax1.set_xlim(x[0],x[-1])
    ax1.set_xticks((0,0.5,1.,1.5,2))
    ax1.set_ylim([0.,t.max()])
    ax1.set_xlabel(r"Distance $x$")
    ax1.set_ylabel(r"Time $t$")

    plt.show()


def main():
    # -- DEFINE SIMULATION PARAMETERS
    x_min = 0.
    x_max = 2.
    Nx = 512
    t_min = 0.
    t_max = 6.0
    Nt = 30000
    n_skip = 10
    delta = 0.022

    # -- INITIALIZATION STAGE
    # ... COMPUTATIONAL DOMAIN
    x = np.linspace(x_min, x_max, Nx, endpoint=False)
    k = FTFREQ(x.size,d=x[1]-x[0])*2*np.pi
    # ... KORTEWEG DEVRIES MODEL
    Lk = -1j*k*k*k*delta*delta
    Nk_fun = lambda uk: 0.5j*k*FT(IFT(uk)**2)
    # ... SOLVER BASED ON INTEGRATING FACTOR METHOD
    solver = IFM_RK4IP(Lk, Nk_fun)
    # ... INITIAL CONDITION
    u_0x = np.cos(np.pi*x)
    solver.set_initial_condition(k, FT(u_0x))

    # -- RUN SIMULATION
    solver.propagate(z_range = t_max, n_steps = Nt, n_skip = n_skip)

    plot_evolution_KdV( solver.z, x, np.real(solver.utz))


if __name__=='__main__':
    main()
Total running time of the script: ( 0 minutes 6.980 seconds)